Graphical Equation
The Graphical Equation toolbar is the most visual method of inserting mathematical statements into SLATE. Statements are inserted by using your mouse to select mathematical symbols from a toolbar of all available symbols.
This is the suggested method for users who only insert math into text occasionally, as it is very visual and simple to use. However, for users who want to incorporate math into text more frequently, using the graphical equation toolbar is a slower and less powerful tool than the other methods explored in this section.
The Graphical Equation Toolbar
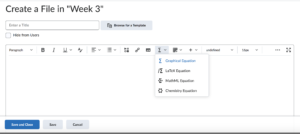
Select the triangle on the right of the ![]() symbol, and from the drop-down menu select Graphical Equation to access the Graphical Equation toolbar. There are many tabs on the toolbar, each corresponding to a set of mathematical symbols.
symbol, and from the drop-down menu select Graphical Equation to access the Graphical Equation toolbar. There are many tabs on the toolbar, each corresponding to a set of mathematical symbols.
NOTE: Less common symbols are often hidden in drop-down menus. If you cannot find the symbol you are looking for, check if the section where you believe it should be contains a small arrow button. Click this to reveal a drop-down menu of more symbols. See the “not equal to” example to the right.